An Introduction to Topic Models
that link at the end of the video, if you’re interested: http://bit.ly/sw-tm-tour
Topic Modeling with the TMTool
There are many tools that can fit a topic model to your text. The easiest one to use is a graphical user interface overlaid on the MALLET Toolkit called ‘The Topic Modeling Tool’ by Jonathan Enderle.
- Follow Enderle’s instructions for downloading and installing the tool here
- Make a new directory on your machine called
tmt. Make a subdirectory intmtcalledinput. - Make a new subdirectory in
tmtand call itoutput. - Download, unzip, and then copy the text files from the Scottish Chapbooks dataset into your
inputdirectory. - Start up the Topic Modeling Tool; you’ll see this interface:
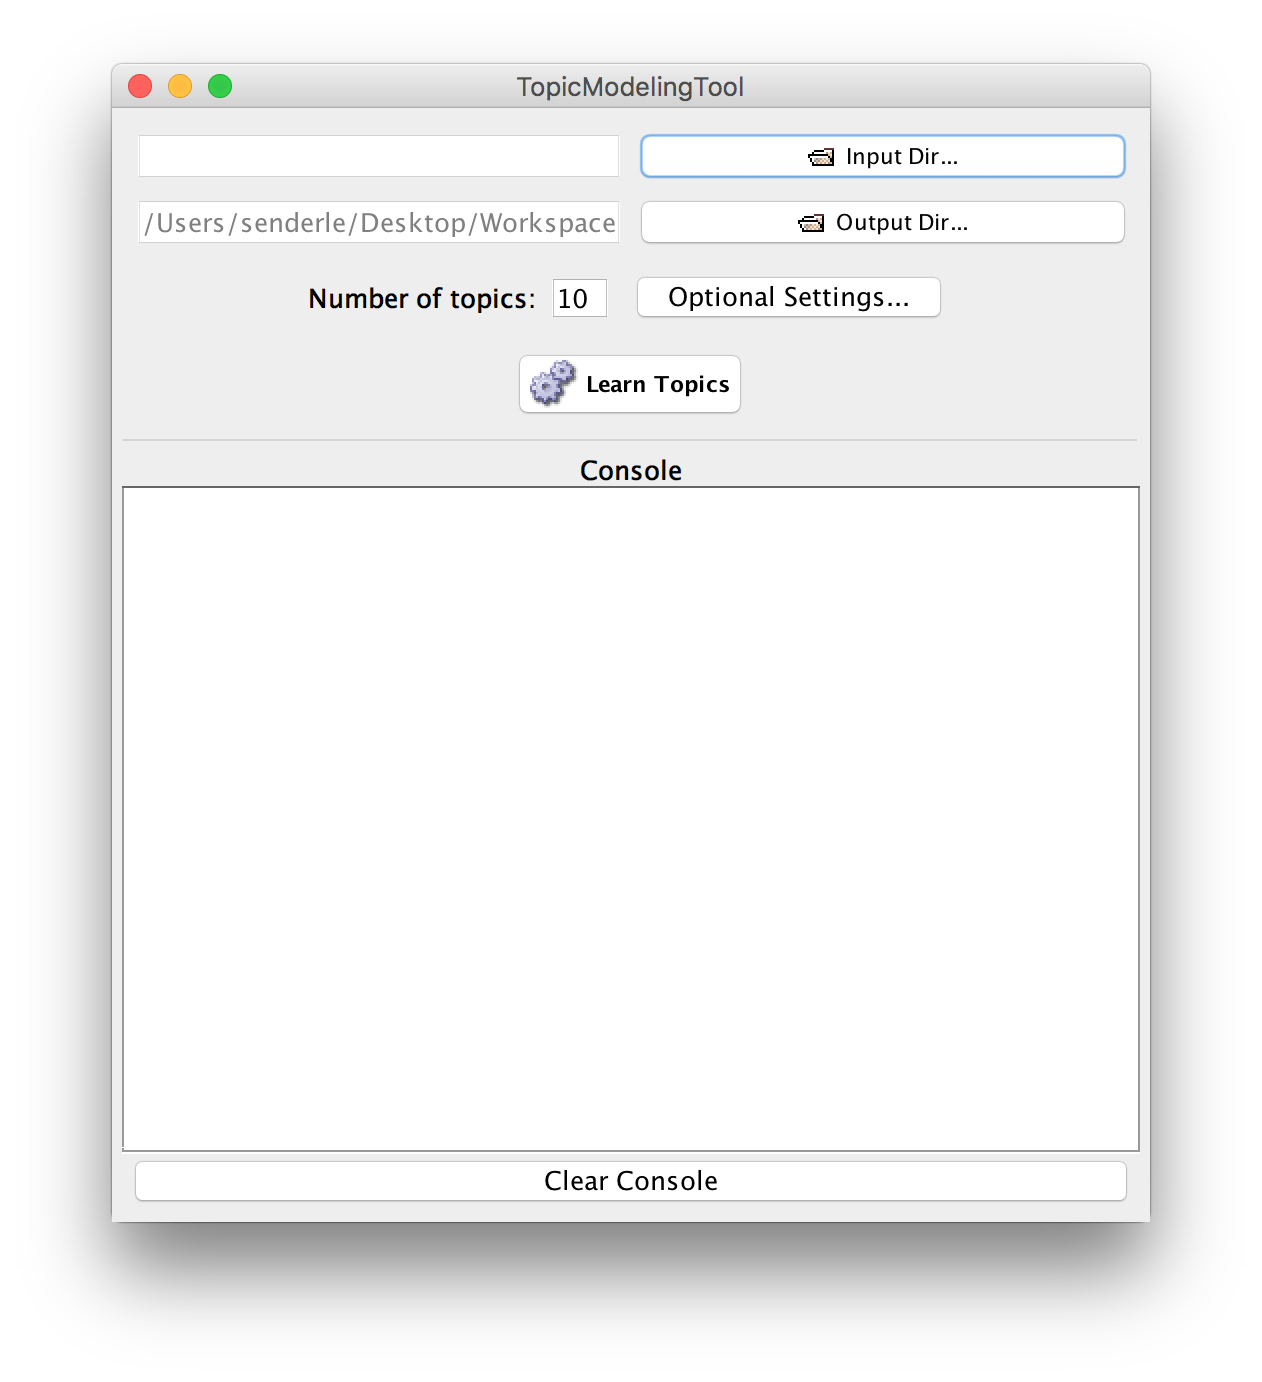
- Click on
and select your
inputfolder but only click once. If you double click, you go into the folder, and that’s not what you want. - Select where you want the output from the process to go. Click on the output button, and select your
outputdirectory. - Decide on how many topics you want to look for, and then click ‘learn topics’
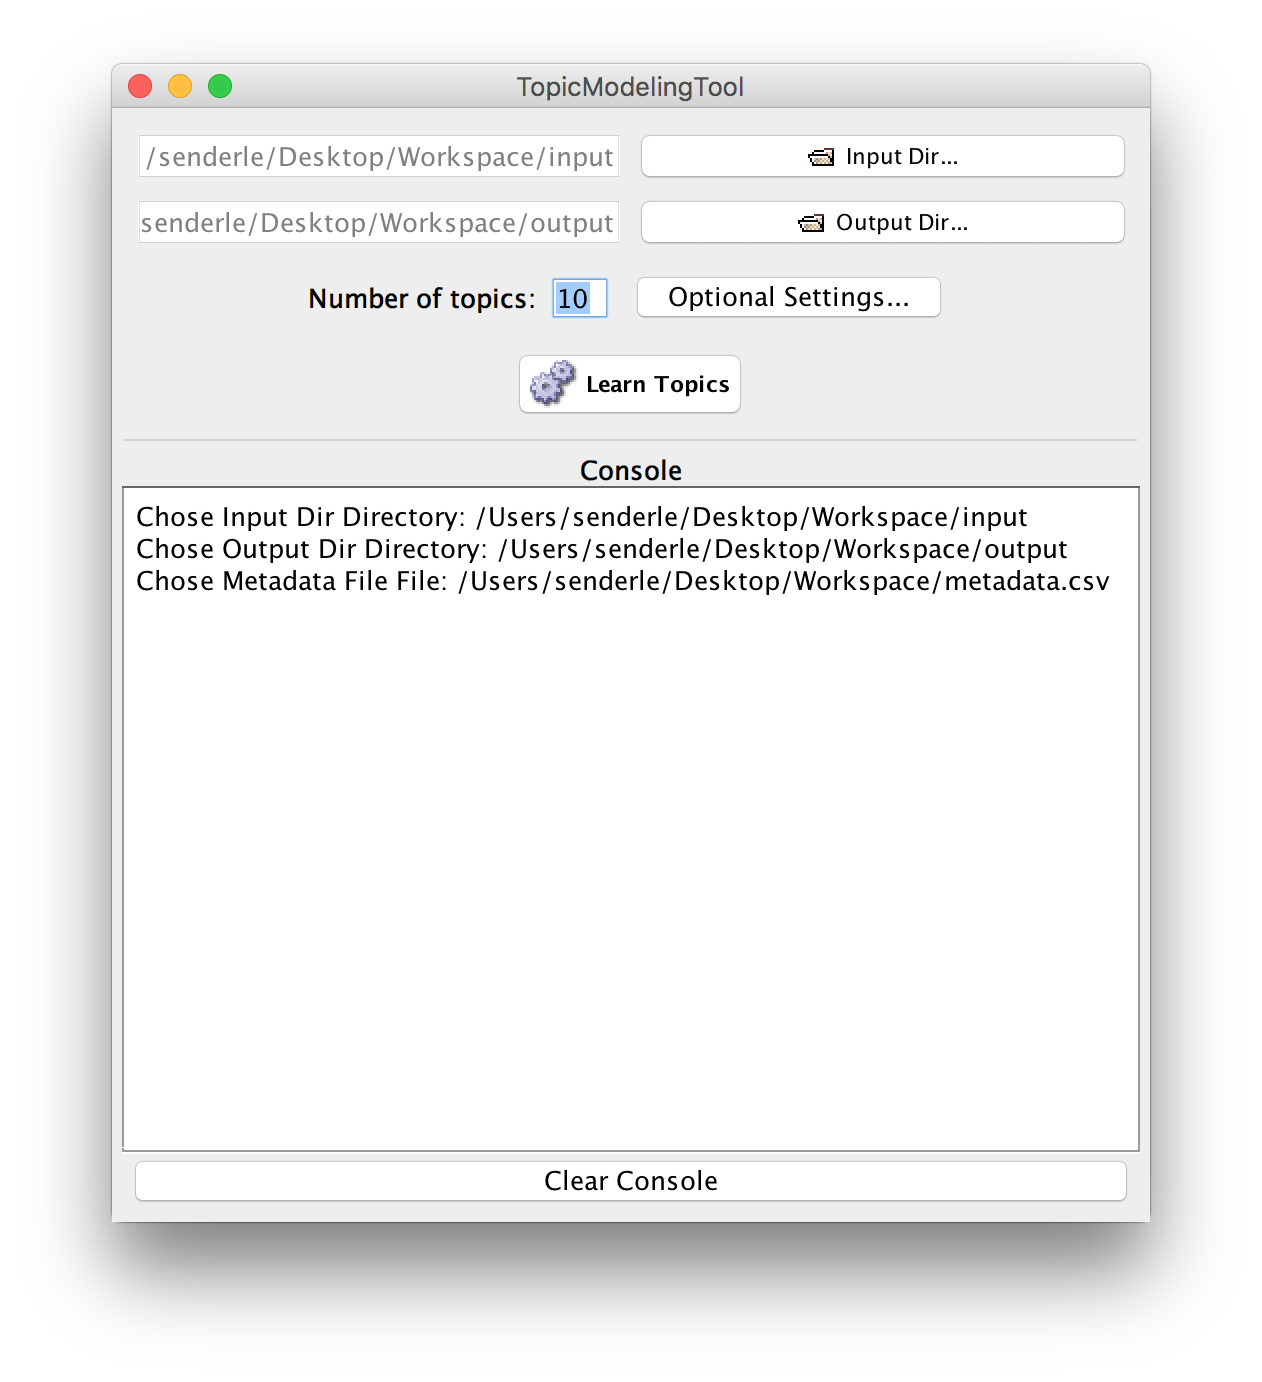
And soon the console will load up with results. If you watch carefully, you’ll see the console build up the original command that it feeds to MALLET (and which, if you were working with MALLET at the command line, you’d have to put together yourself). It will run through several iterations (which you can tweak on the ‘optional settings’ button) to try to find the best fit of your number of topics to the data.
But what does it mean?
Ah, well… for that, please read ‘Very Basic Strategies for Interpreting Results from the Topic Modeling Tool’ by Andy Wallace; follow that up Enderle’s section on analyzing the output from his quickstart guide (scroll down).
Click on your output folder, and then the output_html folder you’ll find inside. Click on the index.html; this will open in your browser, and it will show you the topics it found as lists of each topic’s keywords; click on a topic, and it’ll show you the relevant documents; click on a document and it’ll give you a text snippet for that document, plus clickable links to the other documents present in that document. It’s a bit of a topic browser, and lets you cycle from distant to close and back again as you explore your results.
A bit of visualization is always useful though. Try making a pivot table, as Enderle describes. Make some charts, as Wallace describes. What decisions do you have to make, to make sense of the materials? What other data might you need in order to figure out what these patterns might mean?